 Nix McRetro
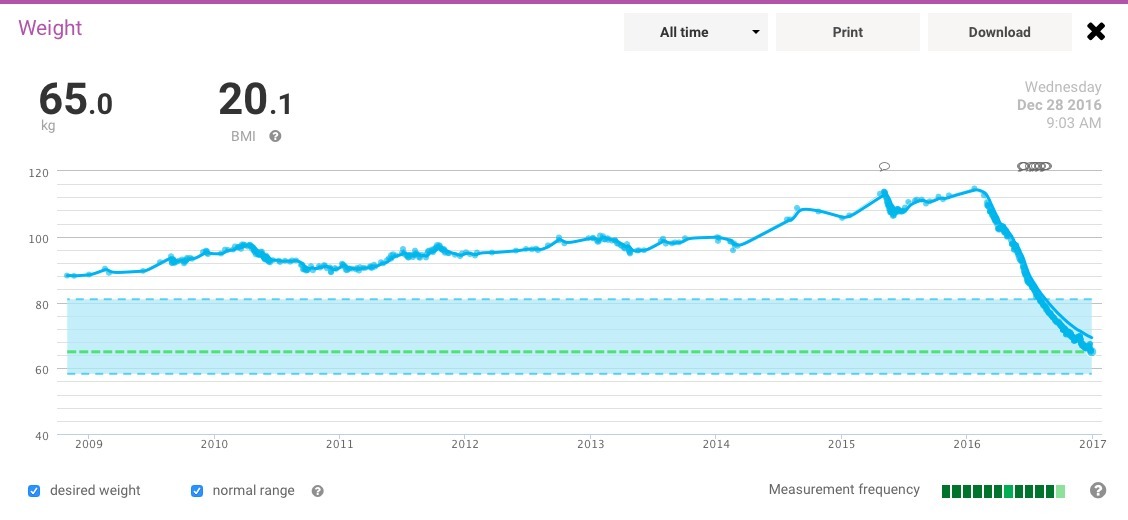
Incredible, isn’t it? From 114.7kg to 65.0kg: 49.7kg down, or about 43% of my starting weight.
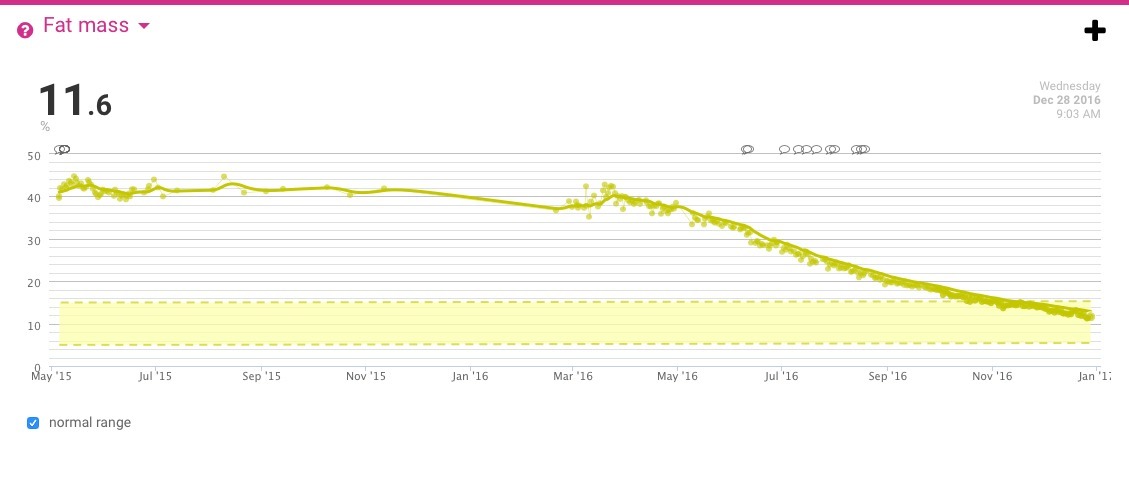
The scale’s estimated body-fat figure is down, down, down!
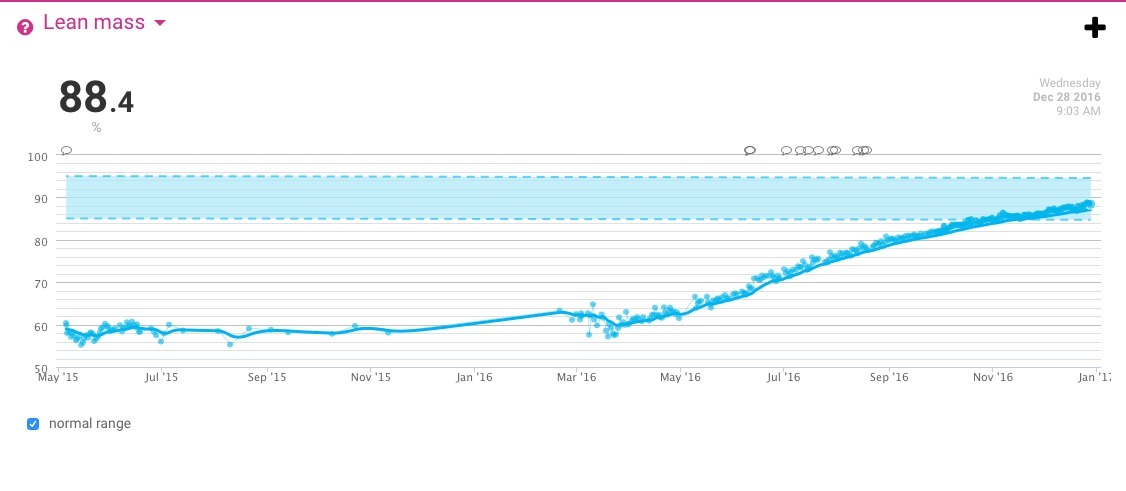
And its estimated lean-mass percentage is up, up, up!
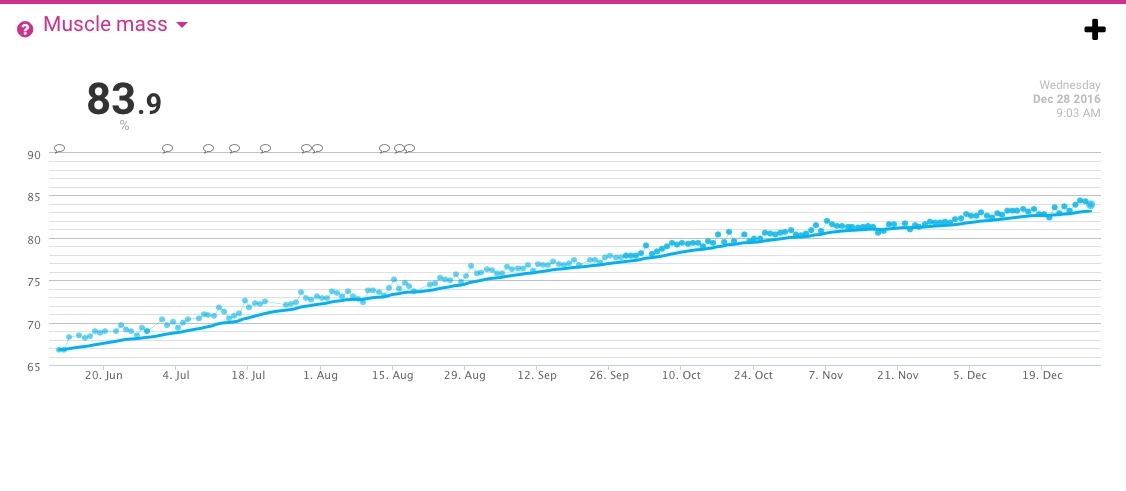
The scale also gives separate estimates for things like muscle mass and…
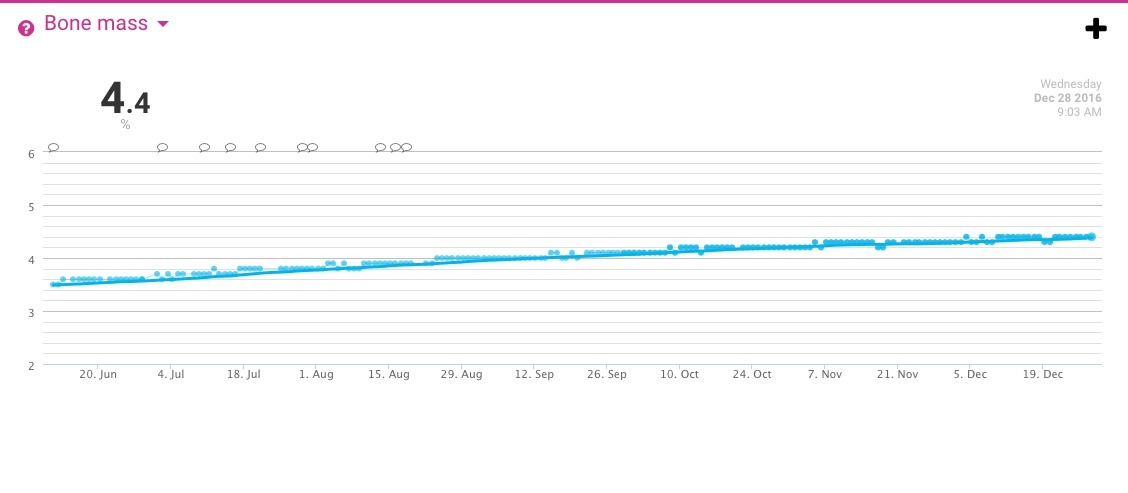
Bone mass! These body-composition graphs show consumer-scale estimates as percentages, not clinical tissue measurements. A rising percentage does not mean the tissue’s weight increased, but I was enjoying watching the trend.
The real question is… can I maintain this weight in the healthy range long term? Stay tuned to find out as I go on a cake-eating-rampage to test out this theory! :P