 Nix McRetro
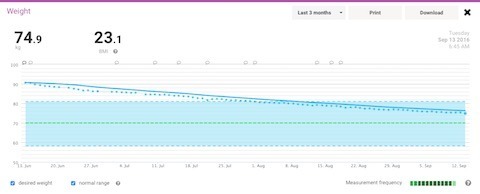
Steady as she goes, captain! Over the previous three months the recorded rate was sitting around 1.2 kg per week. That was still faster than the rate I had been aiming for, so even at the time I recognised that I wanted to slow things down.
My goals were:
- Under 100 kg
- 81 kg, the BMI category I was aiming to enter
- 75 kg
- 70 kg
- Maintain 70 kg rather than continue losing forever
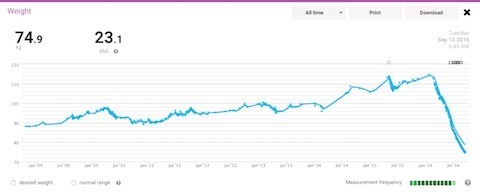
The scale had gone from 114.7 kg to 74.9 kg, a recorded difference of 39.8 kg. Just a little further and it would be a nice round 40 kg. That’s more than half my current weight. Way past cool!
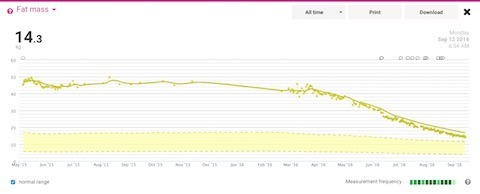
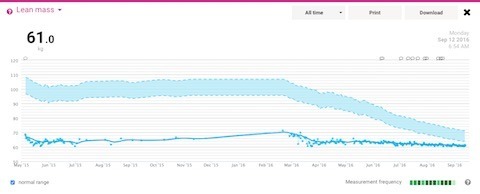
The body-fat and lean-mass graphs came from a consumer body-composition scale. Those are estimates, so I should not treat the apparent kilogram changes as direct measurements of fat tissue or muscle tissue. I originally guessed that the lean-mass decline was simply because my body no longer needed as much tissue to support the higher weight, but I did not actually have evidence for that explanation. The useful thing here is the recorded trend, not a retrospective diagnosis of what every part of the scale’s estimate meant.
Likewise, the amount of carbohydrate or sugar I happened to be eating cannot tell me what my cholesterol or blood glucose results will be. If I want those numbers, a blood test is considerably more persuasive than me guessing at them. Sanitarium Up&Go remains innocent until proven guilty. ;-)